Nearly 50% of respondents to a survey ranked Deputy Prime Minister and Minister of Health Chris Fearne as one of their top three best performing ministers, data obtained via Malta Survey shows.
With a sample size of 1,600, this is the first political survey to be carried out following an agreement signed by Standard Publications Limited and IDEA Intelligence, which administers maltasurvey.com. The agreement is for the development of periodic national surveys on politics, current affairs and other subjects of public interest. A first survey on public sentiment during summer was published in August.
Standard Publications is the publisher of The Malta Independent on Sunday, The Malta Independent (daily), The Malta Business Weekly and www.independent.com.mt
IDEA Intelligence is a data-driven business intelligence wing of the IDEA Group that aims to deliver thorough quantitative insights and information through sophisticated data.
This survey was carried out between 1 and 8 September, ending at 9am on the last day. The results may have been affected by the benefits fraud scandal, which broke on 3 September, while responses were being filed.
The first part of the survey, showing that if an election were to take place tomorrow, the Nationalist Party would receive 0.4% more votes than the Labour Party, and that Robert Abela is trusted more as a leader than Bernard Grech, was published in The Malta Independent on Sunday yesterday.
One section of the survey gave respondents an optional question to answer, asking them to pick their top three performing ministers. The Prime Minister was not included as an option.
A minister could not be selected more than once by each respondent. The choices are ranked such that a first choice given by a respondent has more weight than their second choice and their second choice has more weight than their third choice; choices are not equally weighted.
The results clearly show that Fearne is seen as the top performing minister.
32.3% marked Fearne as their first choice, 7.8% marked him as their second choice and 6.4% marked him down as their third choice. This means that 46.5% marked Fearne down as one of their top three choices.
Minister for Social Justice and Solidarity, the Family and Children's Rights Michael Falzon came in second, in terms of the percentage of respondents who marked him down as one of their top three choices. 4.9% marked him as their first choice, 9.3% their second choice and 5.7% their third choice. This means that 19.9% chose him as one of their top three choices.
Finance Minister Clyde Caruana had the third highest percentage of people marking him down as one of their choices (19.5%). 5.6% marked him down as their first choice, 7.3% as their second choice and 6.6% as their third choice. While slightly more people marked down Caruana as their first choice than Michael Falzon, slightly fewer people included him as one of their top three choices.
The rest of the top 10 are: Miriam Dalli ranked fourth, (17.5% of respondents marked her as their first, second or third choice), Jo Etienne Abela ranked fifth (14.8% of respondents marked him as their first, second or third choice), Ian Borg ranked sixth (13.6% of respondents marked him as their first, second or third choice), Clifton Grima ranked seventh (12.3%), Byron Camilleri ranked eighth (9.8%), Owen Bonnici ranked ninth (10%), and Clint Camilleri ranked tenth (7.2%).
The reason Byron Camilleri is ranked above Owen Bonnici, even though latter saw more people mark him down as one of their top three ministers, is due to the weighting given of first, second and third choice allocations as explained earlier.
The rest of the ministers saw lower scores or saw nobody mark them down as one of their three choices.
The top three performing ministers were further analysed to understand the source of their support based on which party respondents said they would vote for if an election were to be held tomorrow.
Minister Fearne shows a high level of support from the Labour Party's potential voters, who possess the majority in each of the three choices of support. Furthermore, there is a substantial portion of support for Fearne coming from potential PN voters and non-voters.
Of those who selected Fearne as their first choice, 48% would vote Labour if an election were to be held tomorrow, while 22.6% would vote Nationalist. 16.1% wouldn't be voting and the rest are either not sure or would be voting for a smaller party.
Labour Party potential voters formed the largest percentage of those who gave Minister Michael Falzon their first choice, closely followed by Nationalist Party potential voters. Potential Labour Party voters show a substantial majority source of support for the 2nd and 3rd choice for Falzon. Once more, a significant source of support for Falzon was shown by potential non-voters.
33.8% of those who marked him down as their first choice would vote for the PL if an election were to be held tomorrow, while 32.4% had said they would vote PN. 21.6% said they would not vote and the rest are either unsure or would vote for smaller parties.
In terms of those who put Falzon down as their second choice, 53.3% would vote PL in an election.
Minister Clyde Caruana's primary source of first choices comes from potential PN voters, followed by potential Labour Party voters and non-voters. Second and third choices for Caruana both have a main source from potential PL voters, followed by PN voters and non-voters, the latter category with a larger gap.
In terms of respondents who placed Caruana as their first choice, 39.3% said they would vote for the PN if an election were to be held tomorrow, while 27.4% said they would vote PL. 23.8% said they wouldn't vote and the rest either do not know or would vote for smaller parties.
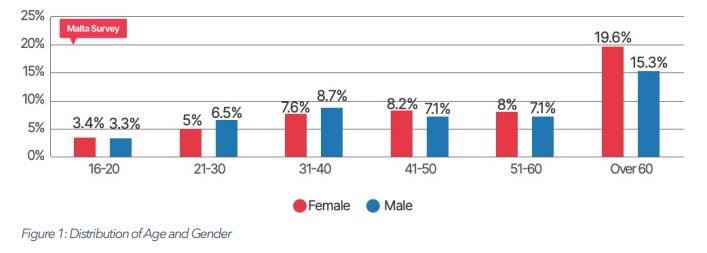
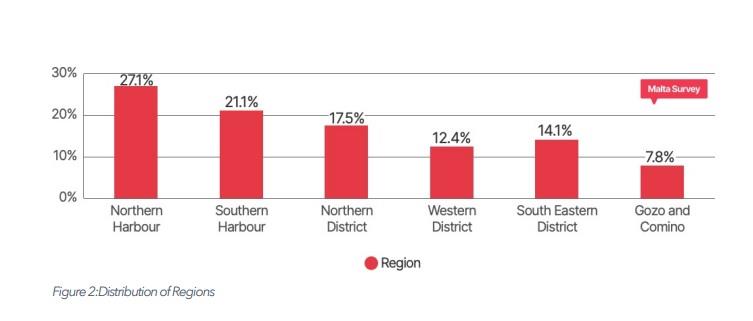
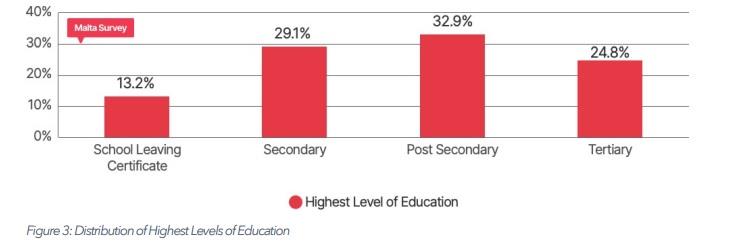
Survey demographics
The charts below show the demographics of the survey participants.
The first results of the survey were published yesterday. If an election were to be held tomorrow, the PN would receive a marginal 0.4% more votes than the PL, but Prime Minister Robert Abela enjoys more trust than Opposition Leader Bernard Grech.

Methodology
This online survey was carried out between 1 and 8 September 2023. The disability benefits scandal broke on 3 September, as responses were being collected.
Online advertisements were shown on social media platforms and all participants opted to take part in the survey voluntarily. Data gathering was administered by MaltaSurvey.com without input from The Malta Independent to prevent any potential reader bias. Submissions were gathered through MaltaSurvey.com's proprietary platform and full anonymity of the sample base was ensured. Analysis was done using data science tools including Python, Julia, SPSS and Jupyter Notebooks.
Whilst the sample is fully anonymous, demographic variables were utilised in the initial set of questions in order to keep control of the representativeness of the sample. The target population was people living in Malta who are at least 16 years of age. NSO publications were used to establish the required proportions of the sample by Gender, Age, Region and Education. After collecting the sample, the cases were weighted by the same four variables (Gender, Age, Region and Education) to ensure a close representation of the sample. In addition, past electoral performances were used in the weighting procedure.
The survey sample voter distribution reflected the voter distribution in the 2022 elections. For instance, 34.3% of the sample said they voted PN in 2022, where in the actual 2022 result the PN got 34.7% of the votes. The biggest percentage difference could be seen when it comes to the 2022 PL votes. In 2022, the Labour Party garnered 45.8% of the vote, whereas in the survey sample, 49.5% said they voted for the Labour Party. One must also keep in mind that while there were invalid votes in the actual election, there obviously wasn't an option for this in the survey.
In the 2022 election, 14.3% of the voters chose not to exercise their right. In this survey, 14.1% of the participants said they did not vote.
The results have a 2.5% margin of error at a 95% confidence level. Specific sub-divisions by demographics and/or specific cohorts have significantly larger margins of error.
Tomorrow: What are the major concerns of the Maltese people?