The Electoral Commission said Sunday that the voter turnout for European Parliament elections was 72.82 per cent of the total registered voters, while 59.47% of the total number of registered voters for the local councils.
In a press statement issued after 3am Sunday, the commission gave a breakdown district by district for the EP election, and locality by locality for local councils.
The turnout for the EP election is slightly higher than the one for 2019, when 72.7% had turned up to vote. In the first election in 2004, we had 84.4% of the electorate voting, followed by 78.8% in 2009, 74.8% in 2014 and 72.7% in 2019.
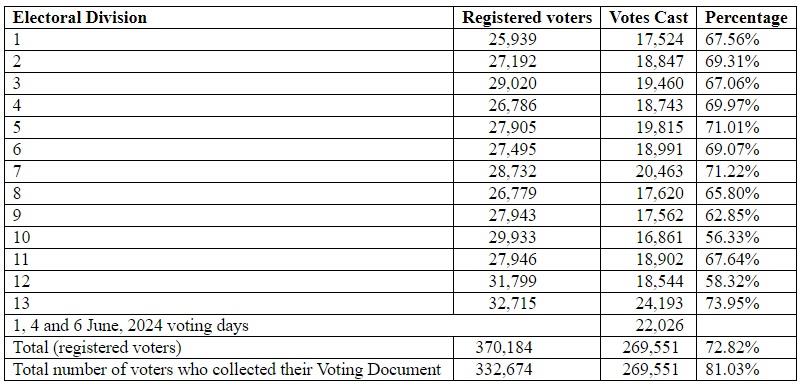
As can be seen in table below, the total number of registered voters was 370,184, with 332,674 collecting their vote. Of these, 269,551 cast their preference.
The highest turnout, in percentage terms, was in Gozo, at nearly 74%, while the lowest turnouts were in the 10th (Sliema) and in the 12th districts (Mellieha), the only two which fell below the 60% mark at 56.33% and 58.32% respectively.
The fifth and seventh districts went above 70%.
Just over 22,000 voted early.
As for local council elections, the lowest turnout was in St Julians, where only 26% of the voters cast their preference, followed by St Paul's Bay and Sliema on 28%.
Kercem had the highest turnout at 74 per cent, followed by Dingli on 74% and Santa Lucija on 73%. Other localities where more than 70% of the registered voters wenbt to the polling booth are Zejtun, Gudja, Mqabba, Safi, Siggiewi, Mtarfa and Fontana.
European Parliament elections
Local councils
|
1.
|
Il-Belt Valletta
|
58.97%
|
|
2.
|
Floriana
|
60.54%
|
|
3.
|
Il-Hamrun
|
61.68%
|
|
4.
|
Il-Marsa
|
65.00%
|
|
5.
|
Tal-Pieta'
|
46.92%
|
|
6.
|
Santa Venera
|
62.03%
|
|
7.
|
Il-Birgu
|
58.55%
|
|
8.
|
L-Isla
|
63.75%
|
|
9.
|
Bormla
|
57.98%
|
|
10.
|
Haz-Zabbar
|
67.75%
|
|
11.
|
Il-Fgura
|
66.09%
|
|
12.
|
Il-Kalkara
|
63.14%
|
|
13.
|
Ix-Xghajra
|
59.60%
|
|
14.
|
Iz-Zejtun
|
70.63%
|
|
15.
|
Hal Ghaxaq
|
68.67%
|
|
16.
|
Marsaskala
|
45.82%
|
|
17.
|
Marsaxlokk
|
65.57%
|
|
18.
|
Il-Gudja
|
70.98%
|
|
19.
|
Paola
|
65.17%
|
|
20.
|
Santa Lucija
|
73.53%
|
|
21.
|
Hal Tarxien
|
66.53%
|
|
22.
|
Birzebbuga
|
57.02%
|
|
23.
|
L-Imqabba
|
70.33%
|
|
24.
|
Hal Kirkop
|
67.23%
|
|
25.
|
Hal Luqa
|
65.34%
|
|
26.
|
Il-Qrendi
|
68.36%
|
|
27.
|
Hal Safi
|
71.52%
|
|
28.
|
Iz-Zurrieq
|
69.35%
|
|
29.
|
Hal Qormi
|
68.13%
|
|
30.
|
Haz-Zebbug (Malta)
|
66.88%
|
|
31.
|
Is-Siggiewi
|
70.26%
|
|
32.
|
Had-Dingli
|
74.23%
|
|
33.
|
L-Imgarr
|
63.92%
|
|
34.
|
L-Imtarfa
|
70.35%
|
|
35.
|
Ir-Rabat (Malta)
|
67.22%
|
|
36.
|
Hal Balzan
|
60.38%
|
|
37.
|
Birkirkara
|
56.68%
|
|
38.
|
L-Iklin
|
62.86%
|
|
39.
|
Hal Lija
|
57.78%
|
|
40.
|
Hal Gharghur
|
59.23%
|
|
41.
|
L-Imsida
|
32.35%
|
|
42.
|
San Gwann
|
53.16%
|
|
43.
|
Is-Swieqi
|
36.54%
|
|
44.
|
Ta' Xbiex
|
45.41%
|
|
45.
|
Il-Gzira
|
28.87%
|
|
46.
|
Pembroke
|
57.35%
|
|
47.
|
San Giljan
|
26.69%
|
|
48.
|
Tas-Sliema
|
28.37%
|
|
49.
|
H' Attard
|
62.54%
|
|
50.
|
Il-Mosta
|
61.20%
|
|
51.
|
San Pawl il-Bahar
|
28.57%
|
|
52.
|
Il-Mellieha
|
46.90%
|
|
53.
|
In-Naxxar
|
57.19%
|
|
54.
|
Mdina
|
*
|
|
55.
|
Ir-Rabat (Ghawdex)
|
65.47%
|
|
56.
|
Il-Fontana
|
72.54%
|
|
57.
|
Ghajnsielem
|
58.36%
|
|
58.
|
L-Gharb
|
56.47%
|
|
59.
|
L-Ghasri
|
63.58%
|
|
60.
|
Ta' Kercem
|
75.04%
|
|
61.
|
Il-Munxar
|
57.62%
|
|
62.
|
In-Nadur
|
65.51%
|
|
63.
|
Il-Qala
|
59.65%
|
|
64.
|
San Lawrenz
|
52.24%
|
|
65.
|
Is-Sannat
|
66.97%
|
|
66.
|
Ix-Xagħra
|
62.44%
|
|
67.
|
Ix-Xewkija
|
67.35%
|
|
68.
|
Iz-Zebbug (Ghawdex)
|
45.97%
|
|
|
Percentage of votes cast against the total number of registered voters
|
59.47%
|
|
|
Percentage of votes cast against the total number of voters who collected their Voting Documents
|
78.48%
|